
- Source column 1

- Source column 2
Français
CORE THEMES
HIGHLIGHTS
STATISTICS
Data Centre
CURRENT SURVEYS
PUBLICATIONS
ABOUT THE UIS
Printable Version
PDF Version
- Source column 1, spans 2 columns
UIS STATISTICS IN BRIEF
- Source column 1
Education in Eritrea
- Source column 2
Education - all levels
- Source column 1, spans 2 columns
Sub-Saharan Africa
- Source column 1, spans 2 columns
General information
- Source column 1, spans 2 columns
2005
- Source column 1
Total population (000)
- Source column 2
4 401
- Source column 1
Annual population growth rate (%) *
- Source column 2
- Source column 1
(2004)
- Source column 2
4.3
- Source column 1
Population 0-14 years (%)
- Source column 2
41
- Source column 1
Rural population (%) *
- Source column 2
- Source column 1
(2004)
- Source column 2
80
- Source column 1
Total fertility rate (births per woman) *
- Source column 2
- Source column 1
(2004)
- Source column 2
5.3
- Source column 1
Infant mortality rate (0/00) *
- Source column 2
- Source column 1
(2004)
- Source column 2
52
- Source column 1
Life expectancy at birth (years) *
- Source column 2
- Source column 1
(2004)
- Source column 2
54
- Source column 1
HIV rate (%) in adults (15-49 years) *
- Source column 2
- Source column 1
(2003)
- Source column 2
2.7
- Source column 1
Poverty (% of pop. on less than $2 a day) *
- Source column 2
...
- Source column 1
GDP per capita (PPP) US$ *
- Source column 2
- Source column 1
(2004)
- Source column 2
977
- Source column 1
GDP growth rate (%) *
- Source column 2
- Source column 1
(2004)
- Source column 2
1.8
- Source column 1
Total debt service as a % of GNI *
- Source column 2
- Source column 1
(2004)
- Source column 2
2.1
- Source column 1
Children of primary school-age who are out-of-school (%)
- Source column 2
52
* World Bank World Development Indicators
- Source column 1, spans 2 columns
Participation in education
- Source column 1, spans 2 columns
Percentages of children in school are represented by Gross Enrolment Ratios (GER) and Net Enrolment Ratios (NER). GER is the number of pupils enrolled in a given level of education regardless of age expressed as a percentage of the population in the theoretical age group for that level of education. NER is the number of pupils in the theoretical age group who are enrolled expressed as a percentage of the same population.
- Source column 1, spans 2 columns
Pre-primary enrolment
- Source column 1, spans 2 columns
Pre-primary
- Source column 3
1991
- Source column 4
1999
- Source column 5
2002
- Source column 6
2005
- Source column 7
2005 Regional average
- Source column 1, spans 3 rows
GER (%)
- Source column 2
MF
- Source column 3
...
- Source column 4
6
- Source column 5
6
- Source column 6
12
- Source column 7
- Source column 1
(**)
- Source column 2
14
- Source column 2
M
- Source column 3
...
- Source column 4
6
- Source column 5
6
- Source column 6
12
- Source column 7
- Source column 1
(**)
- Source column 2
14
- Source column 2
F
- Source column 3
...
- Source column 4
5
- Source column 5
5
- Source column 6
12
- Source column 7
- Source column 1
(**)
- Source column 2
13
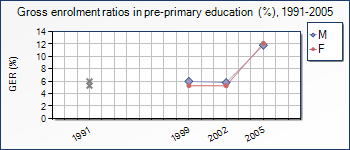
12% of children are enrolled in pre-primary school
Primary enrolment
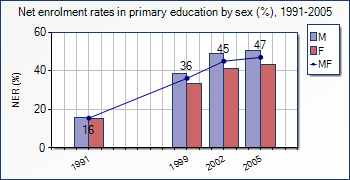
43% of girls and 51% of boys are in primary school
- Source column 1, spans 2 columns
Primary
- Source column 3
1991
- Source column 4
1999
- Source column 5
2002
- Source column 6
2005
- Source column 7
2005 Regional average
- Source column 1, spans 3 rows
GER (%)
- Source column 2
MF
- Source column 3
21
- Source column 4
57
- Source column 5
64
- Source column 6
64
- Source column 7
97
- Source column 2
M
- Source column 3
21
- Source column 4
62
- Source column 5
71
- Source column 6
71
- Source column 7
102
- Source column 2
F
- Source column 3
20
- Source column 4
51
- Source column 5
57
- Source column 6
57
- Source column 7
91
- Source column 1, spans 3 rows
NER (%)
- Source column 2
MF
- Source column 3
- Source column 1
(**)
- Source column 2
16
- Source column 4
36
- Source column 5
45
- Source column 6
47
- Source column 7
- Source column 1
(**)
- Source column 2
70
- Source column 2
M
- Source column 3
- Source column 1
(**)
- Source column 2
16
- Source column 4
39
- Source column 5
49
- Source column 6
51
- Source column 7
- Source column 1
(**)
- Source column 2
73
- Source column 2
F
- Source column 3
- Source column 1
(**)
- Source column 2
15
- Source column 4
34
- Source column 5
41
- Source column 6
43
- Source column 7
- Source column 1
(**)
- Source column 2
67
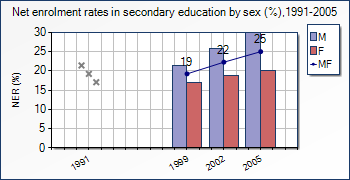
Secondary enrolment
20% of girls and 30% of boys are in secondary school
- Source column 1, spans 2 columns
Secondary
- Source column 3
1991
- Source column 4
1999
- Source column 5
2002
- Source column 6
2005
- Source column 7
2005 Regional average
- Source column 1, spans 3 rows
GER (%)
- Source column 2
MF
- Source column 3
...
- Source column 4
24
- Source column 5
29
- Source column 6
31
- Source column 7
- Source column 1
(**)
- Source column 2
32
- Source column 2
M
- Source column 3
...
- Source column 4
28
- Source column 5
35
- Source column 6
40
- Source column 7
- Source column 1
(**)
- Source column 2
35
- Source column 2
F
- Source column 3
...
- Source column 4
19
- Source column 5
23
- Source column 6
23
- Source column 7
- Source column 1
(**)
- Source column 2
28
- Source column 1, spans 3 rows
NER (%)
- Source column 2
MF
- Source column 3
...
- Source column 4
- Source column 1
(**)
- Source column 2
19
- Source column 5
- Source column 1
(**)
- Source column 2
22
- Source column 6
25
- Source column 7
- Source column 1
(**)
- Source column 2
25
- Source column 2
M
- Source column 3
...
- Source column 4
- Source column 1
(**)
- Source column 2
21
- Source column 5
- Source column 1
(**)
- Source column 2
26
- Source column 6
30
- Source column 7
- Source column 1
(**)
- Source column 2
28
- Source column 2
F
- Source column 3
...
- Source column 4
- Source column 1
(**)
- Source column 2
17
- Source column 5
- Source column 1
(**)
- Source column 2
19
- Source column 6
20
- Source column 7
- Source column 1
(**)
- Source column 2
23
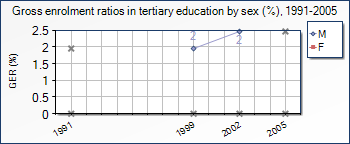
Tertiary enrolment
- Source column 1, spans 2 columns
Tertiary
- Source column 3
1991
- Source column 4
1999
- Source column 5
2002
- Source column 6
2005
- Source column 7
2005 Regional average
- Source column 1, spans 3 rows
GER (%)
- Source column 2
MF
- Source column 3
...
- Source column 4
1
- Source column 5
1
- Source column 6
...
- Source column 7
- Source column 1
(**)
- Source column 2
5
- Source column 2
M
- Source column 3
...
- Source column 4
2
- Source column 5
2
- Source column 6
...
- Source column 7
- Source column 1
(**)
- Source column 2
6
- Source column 2
F
- Source column 3
...
- Source column 4
-
- Source column 5
-
- Source column 6
...
- Source column 7
- Source column 1
(**)
- Source column 2
4
Progression and completion in education
2005
- Source column 1
School life expectancy ISCED 1-6 (years)
- Source column 2
- Source column 1
(**,2004)
- Source column 2
5.6
- Source column 1
Percentage of repeaters, primary (%)
- Source column 2
13
- Source column 1
Survival rate to grade 5 (%)
- Source column 2
- Source column 1
(2004)
- Source column 2
79
- Source column 1
Gross intake rate to last grade of primary (%)
- Source column 2
51
- Source column 1
Primary to secondary transition rate (%)
- Source column 2
- Source column 1
(2004)
- Source column 2
89
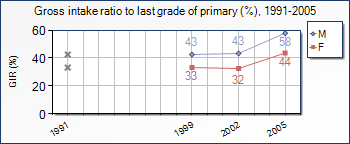
51% of children complete a full course of primary
Resources for education
2005
- Source column 1
Pupil / teacher ratio (primary)
- Source column 2
48
- Source column 1, spans 3 columns
Public expenditure on education :
- Source column 1
as % of GDP
- Source column 2
5.4
- Source column 1
as % of total government expenditure
- Source column 2
...
- Source column 1, spans 3 columns
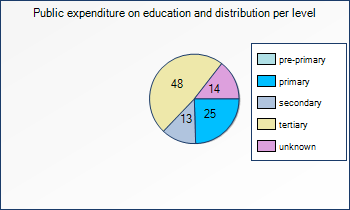
Distribution of public expenditure per level (%) - 2005 :
- Source column 1
pre-primary
- Source column 2
...
- Source column 1
primary
- Source column 2
25
- Source column 1
secondary
- Source column 2
13
- Source column 1
tertiary
- Source column 2
48
- Source column 1
unknown
- Source column 2
14
Literacy rates
- Source column 1, spans 2 columns
Literacy rates
- Source column 3
1990
- Source column 4
2005
- Source column 5
2005 Regional average
- Source column 1, spans 3 rows
Adult (15+) %
- Source column 2
MF
- Source column 3
...
- Source column 4
...
- Source column 5
59.2
- Source column 2
M
- Source column 3
...
- Source column 4
...
- Source column 5
68.7
- Source column 2
F
- Source column 3
...
- Source column 4
...
- Source column 5
50.4
- Source column 1, spans 3 rows
Youth (15-24) %
- Source column 2
MF
- Source column 3
...
- Source column 4
...
- Source column 5
69.4
- Source column 2
M
- Source column 3
...
- Source column 4
...
- Source column 5
75.3
- Source column 2
F
- Source column 3
...
- Source column 4
...
- Source column 5
63.9
Symbols used :
- Source column 1, spans 2 columns
Footnotes:
- Source column 1, spans 2 columns
All the education statistics, with the exception of the literacy data, refer to the year 2005 unless otherwise noted. For more information on rates of out-of-school children, or other indicators see the online education glossary.
- Source column 1
**
- Source column 2
UIS estimation
